Snapshot of the American Wine Consumer in 2014
Snapshot of the American Wine Consumer in 2014
by Liz Thach, Janeen Olsen & Tom Atkin
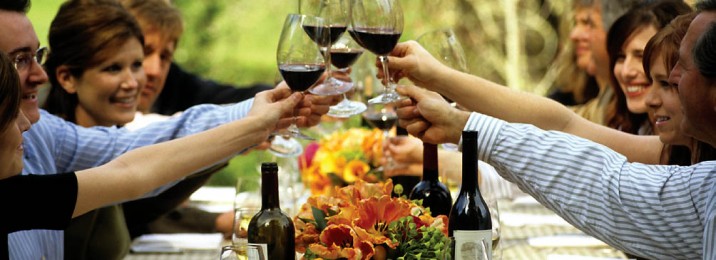
Who is the American wine consumer today? What types of wine do they prefer and where do they purchase their wine? How much do they spend on a bottle of wine in a restaurant? These and other questions are addressed in a new annual survey that researchers at Sonoma State University Wine Business Institute have recently designed.
About the Sample
The online survey was launched in early 2014 with a total of 1028 wine consumers responding to the questions. The data was gathered by a third party market research firm supplying panel data of household wine consumers in America. All fifty states were represented, with more consumers responding from states with higher wine consumption rates. For example, 12 % of the sample were from California, 9% from Florida, 7% from New York and Illinois, and 6% from Texas.
Demographics showed 49% male and 51% female respondents; 59% had a college degree; and 61% made over $50,000 per year. In terms of age, 36% were Millennials (21 – 36), 22% Gen Xers (37 – 48), 34% were Baby Boomers (49 – 67) and 8% were Traditionalists (68 +). The ethnic breakdown of the sample was 72% Caucasian, 12% African-American, 8% Hispanic, 5% Asian with the remaining 3% Mixed or other. These demographics are very similar to other research portraying the American wine consumer.
Wine Consumption Frequency and Preferred Varietals
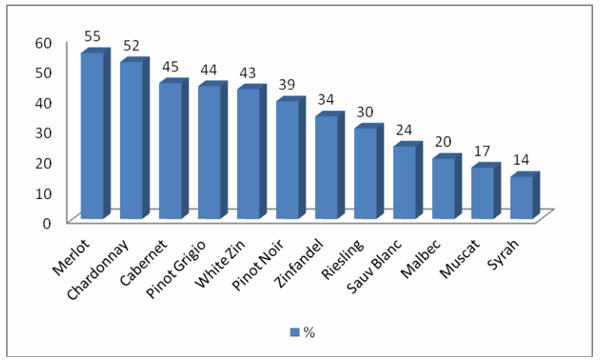
When asked how often they consume wine, 20% of the sample reported drinking wine on a daily basis, 48% several times a week, 18% once a week and the remainder were occasional drinkers at 14%. Respondents were given a list of the 12 most popular varietals in the US, according to Nielsen scan data and asked to select their favorites. Results were slightly different than current scan data with 55% selecting Merlot as a top favorite, followed by Chardonnay at 52%, Cabernet Sauvignon at 45% and Pinot Grigio at 44%.
Figure 1: Preferred Varietals of American Wine Consumer Snapshot 2014
(What are some of your favorite wine varietals? Check all that apply)
Average Price Spent on Wine
When buying a bottle of wine to drink at home, the most common price point was $10 – $15 per bottle with 35% of the sample, whereas 22% spend $8 – 10, 16% spend $15 – 20, and the remainder spent either less or more. When dining at a restaurant, the most common price was $20 – 30 per bottle at 27% of the sample, 17% spending $30 – $40, 12% spending over $40, and the remainder spending less or more. Interestingly, 21% of the sample reported only buying wine by the glass at restaurants. The most common price point for this was $5 – 10 per glass at 61% of the sample.
Preferred Location to Purchase Wine
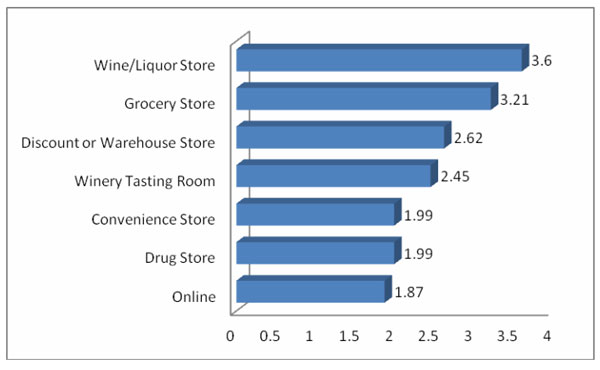
Since this was a national sample, and wine is not sold in grocery stores in every state, it was not surprising to see that the most common location to purchase wine was in a Wine or Liquor Store. Participants were asked to rate how often they purchase wine at these locations with possible responses of Never (0), Rarely (1), Sometimes (2), Often (3), and Almost Always (4). In this study, 25% of the respondents said they purchase wine in a Wine/Liquor store almost always, which caused the overall rating to be 3. 6, whereas only 17% said they almost always purchase wine in a Grocery Store, resulting in an overall rating in that category of 3.21. Online wine sales is still quite small with only 4% of the sample reporting they almost always purchase wine Online.
Figure 2: Most Common Location to Buy Wine
(How often do you buy wine at the following locations?)
Decision-Making Cues to Buy Wine
In addition to using Price and Varietal as decision-making cues when buying wine, 74% of the sample reported that wine Brand was very important, followed by Country at 52%, then Region at 44%. The way the Label looked was important to 38% of the respondents. Least important was Appellation at 12%.
Organic, Sustainable and Biodynamic Wines
Though the Organic Trade Association reports that 41% of American consumers are now buying organic food, this number is not as high with organic beverages. That could explain why only 16% of this sample said they look for organic wine as part of their decision-making process. Listing “sustainable” on the label only was important to 10% and “biodynamic” to 6%. Other research indicates that many Americans assume that most wine is organic anyway and therefore don’t look for these cues, and some consumers confuse the term “biodynamic” with “genetically modified,” which can be a deterrent to purchase.
Social Media and Wine Apps
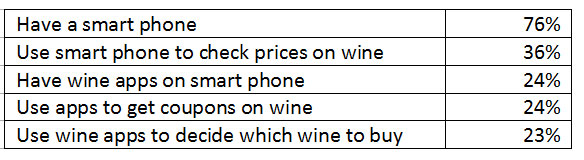
Social media is being adopted in large numbers by American wine consumers with 80% of the sample reporting they use Facebook, 41% Youtube, 39% Twitter, 28% Linked-In, 25% Google+, 24% Pinterest, and 20% Instagram. Only 9% of the sample said they don’t use social media. Of those that do, 13% reported they frequently use social media to get information about wine, look up wine pricing, and ask friends for wine recommendations. An amazing 76% of the sample own a smart phone with around 24% using wine apps.
Table 1: Use of Smart Phone & Wine Apps
Wine Tourism
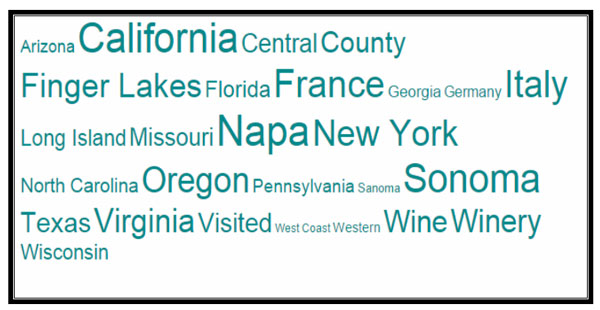
Reports about wine tourism growing appear to be true, according to this sample. When asked if they had visited wineries in other regions to taste wine, 67% of the sample responded positively. They were then asked to type in the names of some of the regions they had visited for wine tourism, which resulted in the “word cloud” picture below. This diagram illustrates the 27 most important words listed, with the larger and darker the font reflecting a higher number of responses. The statistical analysis confirms that in the US, Napa was typed into the data box slightly more times than California, followed by Sonoma (misspelled a few times), New York and Oregon. Outside the US, France was documented slightly more than Italy.
Ongoing Research on Wine Consumers – Additional Questions?
This article reports on the highlights of the American Wine Consumer Survey for 2014. Additional research questions were included on other wine business topics and will be analyzed and published in the future. Researchers at the Sonoma State University Wine Business Institute have received grant money to conduct this American Wine Consumer study on an annual basis. If you have suggestions on additional questions or topics to include, please do not hesitate to contact the authors.
About the Authors: Dr. Liz Thach, MW, Dr. Janeen Olsen and Dr. Tom Aktin are all full-time professors at Sonoma State University. They may be contacted via the university website or lead author, Liz@lizthach.com
Source: www.winebusiness.com